웹페이지는 R의 shiny 라이브러리로 구현하였습니다.
shiny는 페이지를 구현하는 ui 부분과 기능을 구현하는 server 부분으로 나누어져있습니다.
<server.R>
|
1
2
3
4
5
6
7
8
9
10
11
12
13
14
15
16
17
18
19
20
21
22
23
24
25
26
27
28
29
30
31
32
33
34
35
36
37
38
39
40
41
42
43
44
45
46
47
48
49
50
51
52
53
54
55
56
57
58
59
60
61
62
63
64
65
66
67
68
69
70
71
72
73
74
75
76
77
78
79
80
81
82
83
84
85
86
87
88
89
90
91
92
93
94
95
96
97
98
99
100
101
102
103
104
105
106
107
108
109
110
111
112
113
114
115
116
117
118
119
120
121
122
123
124
125
126
127
128
129
130
131
132
133
134
135
136
137
138
139
140
141
142
143
144
145
146
147
148
149
150
151
152
153
154
155
156
157
158
159
160
161
162
163
164
165
166
167
168
169
170
171
172
173
174
175
176
177
178
179
180
181
182
183
184
185
186
187
188
189
190
191
192
193
194
195
196
197
198
199
200
201
202
203
204
205
206
207
208
209
210
211
212
213
214
215
216
217
218
219
220
221
222
223
224
225
226
227
228
229
230
231
232
233
234
235
236
|
#서버 시작
server <- shinyServer(function(input, output) {
user_Data <- reactiveFileReader(100,NULL,"C:/Users/admin/Documents/R/crdentials.csv",read.csv)
observeEvent(input$select,{
dong <- dong_ip[grep(input$select,dong_ip$행정동코드),]
choise <-setNames(dong$행정동코드,dong$행정동명)
choise
output$select_value <- renderUI({
selectInput('select1', label=h3('동 선택'),
choices =choise)
})
})
output$auth_output <- renderPrint({
if(is.null(res_auth))
print(null)
else
reactiveValuesToList(res_auth)
})
output$map <- renderLeaflet({
m
})
# 검색 이벤트
observeEvent(input$search,{
dong_code <- input$select1
print(dong_code)
category <- input$select_category
dong_location <- dong_ip %>% filter(행정동코드==dong_code)
#leaflet 지도 현재 위치 표시하기
output$map <- renderLeaflet({
m%>%setView(lng=dong_location[4], lat=dong_location[3], zoom=14)%>%
addPolygons(data = emd_nn%>%filter(adm_dr_nm==dong_location[[2]]),
fillColor = "red",
fillOpacity = 0.5,
color = "black",
stroke = T,
weight = 1,
group = "regions")%>%
addCircles(data=seoul2%>%filter(상권업종소분류명==category), lng=~경도, lat=~위도, label=~(상호명))
}
)
#rader 차트 출력
output$rader <- renderPlot({
p<-raderchart(dong_code,category)
ggradar(p)+ theme(legend.position = "top")
})
#rader 테이블 출력
output$rader_t <- renderTable({
p<-radertable(dong_code,category)
})
#상가 정보 출력
output$store_info <- renderDataTable({
seoul2 %>% filter(상권업종소분류명==category,행정동코드==dong_code) %>%
dplyr::select(상호명,지점명)%>%
as.data.frame(matrix(rnorm(100),5,5))
},
options = list(
scrollY = 200,
pageLength=5)
)
#시간대별 생활인구 출력
output$time <- renderPlotly({
#code <- get_code(dong_code)
date_time<-time_popul(dong_code)
popul_plot <- ggplot(data=date_time, aes(x =시, y = 생활인구, colour=day)) +
geom_line() +
geom_point(size=2, shape=1) +
coord_cartesian(xlim=c(1,24), expand = FALSE)+theme_bw()
ggplotly(popul_plot) %>% layout(legend = list(orientation = "h", x = 0., y = -0.2))
})
#연령대별 인구 출력
output$age <- renderPlotly({
#code <- get_code(dong_code)
df<-pie_chart(dong_code)
df <- t(df)
df <- data.frame(df)
name_df <- c("10대 이하", "10대", "20대", "30대", "40대", "50대", "60대 이상")
name_df<-data.frame(name_df)
df <- cbind(name_df,df)
df<-df[order(df$df),]
title2 <-as.character(df[7,1])
title1=paste(title2,c("가 가장 많습니다."))
plot_ly(df,labels=~name_df,values=~df) %>%
add_pie(hole = 0.5)%>%
layout(title=title1,
xaxis = list(showgrid = FALSE, zeroline = FALSE, showticklabels = FALSE),
yaxis = list(showgrid = FALSE, zeroline = FALSE, showticklabels = FALSE))
})
#상권 랭킹
output$rank <- renderPlotly({
#code <- get_code(dong_code)
dd <- rank_chart(dong_code)
d<-ggplot(data = dd, aes(x=Var1, y=Freq, fill=Var1)) + geom_col()+theme_bw()+ labs(x="업종", y="점포수")
ggplotly(d)%>% layout(showlegend = FALSE)
})
#개업 폐업
output$open_close <- renderPlotly({
#code <- get_code(dong_code)
md <- open_close_chart(category,dong_code)
md_convi_plot <- ggplot(data=md, aes(x=년도, y= 수치, fill = 개폐업률)) +
geom_bar(stat="identity", position=position_dodge()) + ggtitle("년도별 개업률 및 폐업률") +
geom_text(aes(label=수치),position = position_dodge(0.9))+
theme_bw()
fig <- ggplotly(md_convi_plot)
fig
})
})
useShinyjs()
showElement(id="login_form")
hideElement(id="logout_form")
hideElement(id="data_chart")
observe({
#credentials<-as.data.frame(user_Data())
})
observeEvent(input$login,{
credentials<-data.frame(user_Data())
credentials <- credentials %>% dplyr::select(user,password)
#credentials=data.frame(crede())
print(credentials)
if(input$user_id == ""){
showNotification("아이디를 입력하시오")
}
else if(input$user_pw == ""){
showNotification("비밀번호를 입력하시오")
}
else{
check_id <- credentials %>% filter(user== input$user_id)
print(credentials)
if(nrow(check_id)!=0){
if(check_id[2] == input$user_pw){
output$login_meg <- renderText({
i<-paste(c("환영합니다. ",input$user_id,"님"))
i
})
hideElement(id="login_form")
showElement(id="logout_form")
showElement(id="data_chart")
hideElement(id="submit_form")
}
else
{
showNotification("회원정보가 일치하지 않습니다.")
}
}
else{
showNotification("회원정보가 일치하지 않습니다.")
}
}
}
)
observeEvent(input$submit,{
id=input$submit_id
pw=input$submit_pw
credentials<-data.frame(user_Data())
credentials <- credentials %>% dplyr::select(user,password)
if(id == ""){
showNotification("아이디를 입력하시오")
}
else if(nrow(credentials %>% filter(user== input$submit_id)) != 0){
showNotification("같은 아이디가 존재합니다. 다시입력해 주세요")
}
else if(pw == ""){
showNotification("비밀번호를 입력하시오")
}
else if(input$submit_pw_cf != input$submit_pw){
showNotification("비밀번호가 일치하지 않습니다.")
}
else{
showNotification("회원가입 성공.")
print(crede())
credentials<-data.frame(crede())
print(credentials)
write.csv(credentials,"C:/Users/admin/Documents/R/crdentials.csv")
credentials<-data.frame(user_Data())
credentials <- credentials %>% dplyr::select(user,password)
print(credentials)
}
})
crede<-eventReactive(input$submit,{
credentials<-data.frame(user_Data())
credentials <- credentials %>% dplyr::select(user,password)
new_user <- data.frame(
user = c(input$submit_id),
password = c(input$submit_pw)
)
credentials <- rbind(credentials,new_user)
credentials
})
observeEvent(input$logout,{
showElement(id="login_form")
hideElement(id="logout_form")
hideElement(id="data_chart")
showElement(id="submit_form")
})
})
|
cs |
server.R에서는 ui.R에서 어떻게 출력되는지 어떤 기능을 구현할 것인지 정하게 됩니다.
<ui.R>
|
1
2
3
4
5
6
7
8
9
10
11
12
13
14
15
16
17
18
19
20
21
22
23
24
25
26
27
28
29
30
31
32
33
34
35
36
37
38
39
40
41
42
43
44
45
46
47
48
49
50
51
52
53
54
55
56
57
58
59
60
61
62
63
64
65
66
67
68
69
70
71
72
73
74
75
76
77
78
79
80
81
82
83
84
85
86
87
88
89
90
91
92
93
94
95
96
97
98
99
100
101
102
103
104
105
106
107
108
109
110
111
112
113
114
115
116
117
118
119
120
121
122
123
124
125
126
127
128
129
130
131
132
133
134
135
136
137
138
139
140
141
142
143
144
145
146
147
|
library(shiny)
library(shinymanager)
#
# credentials <- data.frame(
# user = c("shiny", "shinymanager"), # mandatory
# password = c("1234", "12345") # mandatory
# )
#dong <- as.list(dong_ip[2])
ui <- (fluidPage(
tags$head(
tags$style(HTML('#search{text-align:left}'))
),
#verbatimTextOutput("auth_output"),
titlePanel("상권분석"),
tags$br(),
sidebarLayout(
mainPanel(style = "max-height: 900px",
leafletOutput("map",height=900),
width = 8
),
sidebarPanel(useShinyjs(),
wellPanel(id="login_form",
fluidRow(
column(4,textInput("user_id","",width = 150,label = "아이디")),
column(4,passwordInput("user_pw","",width = 150,label = "비밀번호"))),
actionButton("login",label = "로그인"),
actionButton("submit_show",label = "회원가입")
),
conditionalPanel(condition = "input.submit_show % 2 == 1",
wellPanel(id="submit_form",
"아이디",textInput("submit_id","",width = 150),
"비밀번호",passwordInput("submit_pw","",width = 150),
"비밀번호 확인 : ",passwordInput("submit_pw_cf","",width = 150),
actionButton("submit",label = "회원가입")
)),
wellPanel(id="logout_form",
fluidRow(
column(6,textOutput("login_meg"),
),
column(6,actionButton("logout",label = "로그아웃")
),
)
),
fluidRow(column(4,
selectInput("select_category", label = h3("분야 선택"),
choices = list("커피전문점/카페/다방","편의점","라면김밥분식","후라이드/양념치킨","제과점"),
selected = "편의점",width = 200)),
column(3,
selectInput("select", label = h3("구 선택"),
choices = list("종로구" =11110,
"중구" =11140,
"용산구" =11170,
"성동구" =11200,
"광진구" =11215,
"동대문구"= 11230,
"중랑구" =11260,
"성북구" =11290,
"강북구" =11305,
"도봉구" =11320,
"노원구" =11350,
"은평구" =11380,
"서대문구" =11410,
"마포구" =11440,
"양천구" =11470,
"강서구" =11500,
"구로구" =11530,
"금천구" =11545,
"영등포구" =11560,
"동작구" =11590,
"관악구" =11620,
"서초구" =11650,
"강남구" =11680,
"송파구" =11710,
"강동구" =11740
),
selected = 11710650,width = 150)),
column(3,
uiOutput('select_value',label = h3("동 선택"))),
column(2,
br(),br(),br(),
actionButton("search",label = "검색",style="align-item:center;")
)),
width=4,
# Show a plot of the generated distribution
tags$br(),
wellPanel(id="data_chart",
style = "overflow-y:scroll; max-height: 600px",
h4("상권 정보"),
dataTableOutput("store_info"),
plotOutput("rader"),
tableOutput("rader_t"),
h4("개업/폐업률"),
plotlyOutput("open_close"),
h4("시간대별 생활인구"),
plotlyOutput("time"),
h4("연령별 인구"),
plotlyOutput("age"),
h4("상권랭킹"),
plotlyOutput("rank"),
)
),
),
))
|
cs |
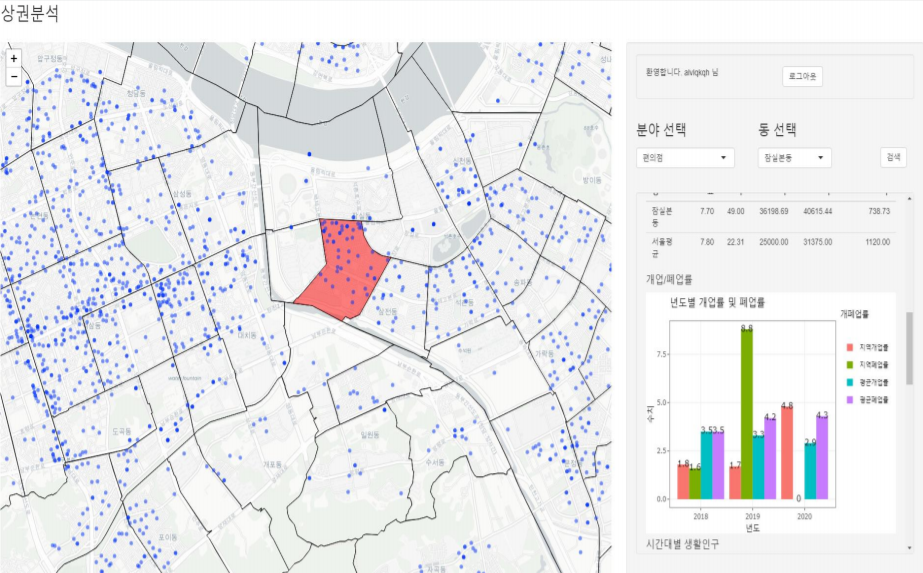
ui는 웹페이지에서 출력하는 부분으로 id에 해당하는 부분을 server에서 읽어들여 출력합니다.
위에서부터 차례로 로그인, 업종/지역 선택, 상권정보, 서울시 평균, 개업/폐업률, 시간대별 인구, 연령별 인구, 상권랭킹 부분을 출력합니다.

'프로젝트 > 상권분석' 카테고리의 다른 글
| [상권분석] - withwork 3. 기능 구현 (0) | 2021.02.23 |
|---|---|
| [상권분석] - withwork 1. 프로그램 개요 (0) | 2021.02.23 |


댓글